
Nightingales metadata code
I created a table and figure to represent the data in the Nightingales datasheet. I have included the code so that the figure and table can be updated in the lab notebook when data is added to Nighingales.
Installing necessary packages
library(tidyr)
library(dplyr)
library(plotly)
library(kableExtra)
library(googlesheets4)
Reading in data, replacing blanks and NAs
nightingales <- read_sheet("https://docs.google.com/spreadsheets/d/1_XqIOPVHSBVGscnjzDSWUeRL7HUHXfaHxVzec-I-8Xk/edit?usp=sharing")

nightingales[nightingales==""]<-NA

nightingales$Primary_taxa[is.na(nightingales$Primary_taxa)] <- "Unknown"
nightingales$Molecule[is.na(nightingales$Molecule)] <-"Unknown"
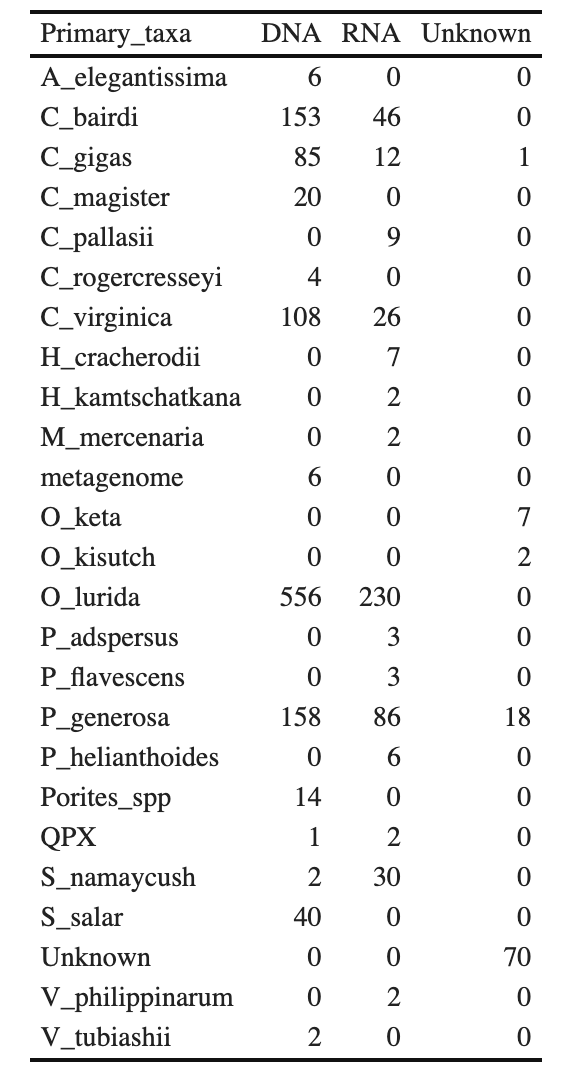
Nightingales Data Table
nighttable <- (nightingales %>%
                 group_by(Primary_taxa, Molecule) %>% summarize(n = n(), .groups = "keep"))

options(knitr.kable.NA = '0')

nighttable %>% pivot_wider(names_from = Molecule, values_from = n) %>% kbl(digits=2) %>%
  kable_classic(full_width = F, html_font = "Cambria")
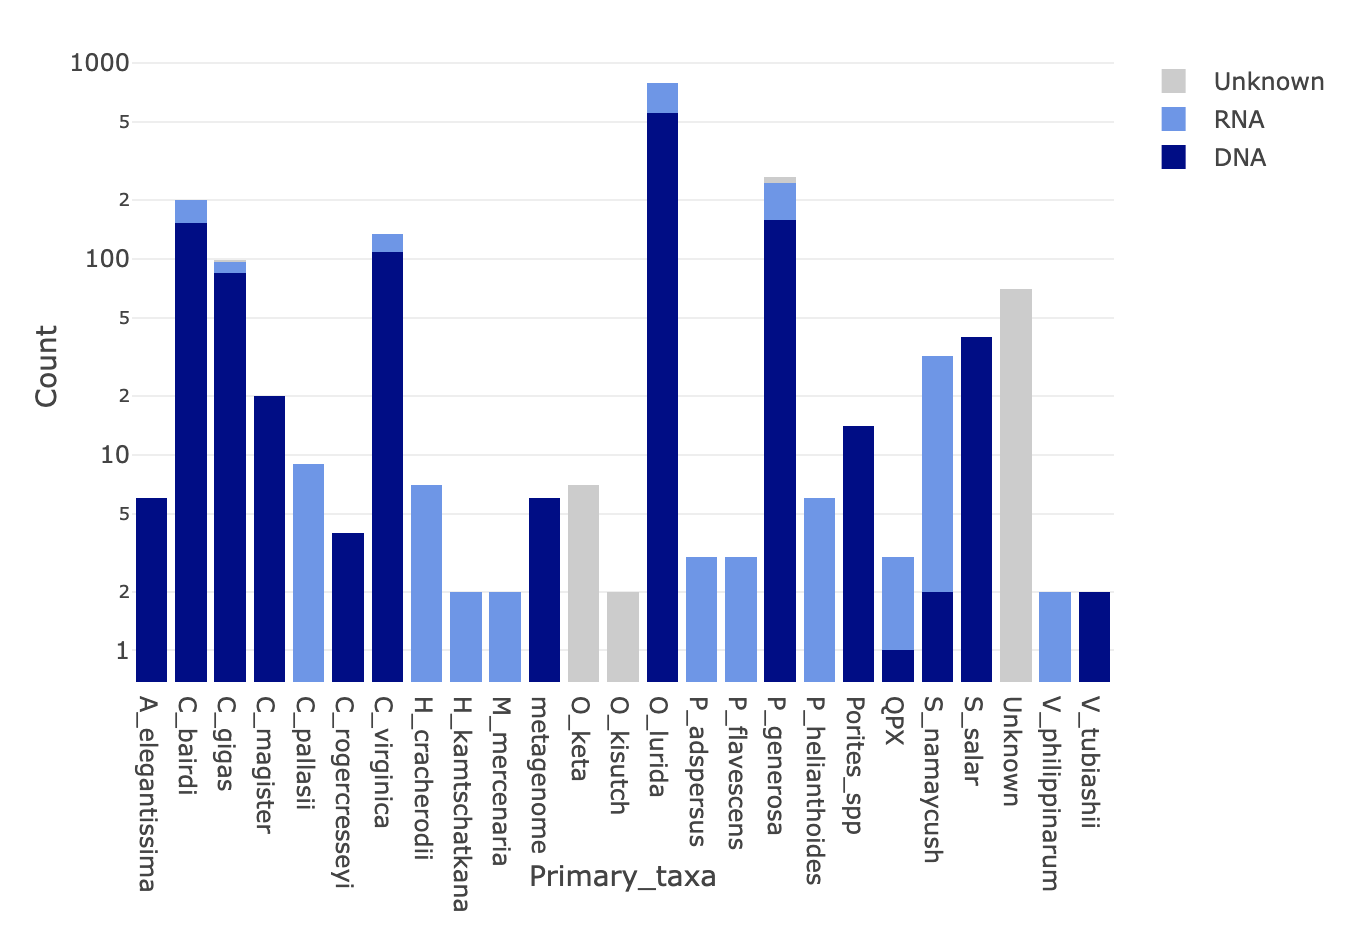
Nightingales Figure (log y axis)
nighttable2 <-(nightingales %>%
                 group_by(Primary_taxa, Molecule) %>% summarize(n = n(), .groups = "keep")  %>% pivot_wider(names_from = Molecule, values_from = n))
nighttable2[is.na(nighttable2)] <- 0

plot_ly(nighttable2, x = ~Primary_taxa, y = ~DNA, name = 'DNA', type='bar', marker = list(color = c("#00008B")))%>%
  add_trace(y = ~RNA, name = 'RNA',type='bar', marker = list(color = c("#6495ED"))) %>%
  add_trace(y = ~Unknown, name = 'Unknown', type='bar',  marker = list(color = c("#CCCCCC"))) %>%
  layout(barmode = 'stack', showlegend = TRUE, yaxis = list(type="log",title = "Count"))
Written on October 10, 2021